Elevate Your Customer Service with the Right Metrics
Everyone understands that outstanding customer service is a must for business growth. Want to measure and improve yours? This listicle details eight essential customer service performance indicators (CSPIs) to track in 2025. Learn how metrics like Customer Satisfaction Score (CSAT) and Net Promoter Score (NPS), along with others like First Call Resolution (FCR) and Average Handle Time (AHT), can reveal key insights into your customer service effectiveness. Using these CSPIs, you can identify areas for improvement, boost customer retention, and optimize your team’s performance. Let’s get started!
1. Customer Satisfaction Score (CSAT)
Customer Satisfaction Score (CSAT) is a customer service performance indicator that directly measures customer happiness with a specific interaction or overall experience. It’s an important tool for understanding how well your business meets customer expectations at critical touchpoints. CSAT surveys typically use a simple rating scale, such as 1-5, 1-10, or even a percentage scale, to gauge customer satisfaction immediately following an interaction. This provides actionable feedback, allowing businesses to identify areas for improvement and enhance the customer journey. This approach makes it a valuable metric for small businesses, customer support teams, sales and marketing professionals, e-commerce managers, and digital agencies alike, helping them understand and improve customer experiences.
CSAT’s strength is in its simplicity. Its straightforward rating scale format makes it quick and easy for customers to complete, often resulting in high response rates. This ease of use also translates to cost-effectiveness for businesses looking to deploy CSAT surveys. Furthermore, the ability to segment CSAT results by product, service, or department allows for targeted analysis and improvement efforts. For instance, an e-commerce business can use CSAT to assess customer satisfaction with specific product deliveries, website usability, or customer service interactions, enabling targeted interventions to address specific pain points.
Several prominent businesses successfully leverage CSAT. Amazon’s post-purchase rating system, Uber’s ride rating system, Apple Store’s post-service email surveys, and Zappos’ follow-up satisfaction surveys are all prime examples of CSAT in action. These companies use CSAT to gather immediate feedback, identify areas for improvement, and ultimately enhance customer loyalty.
While CSAT offers numerous advantages, it also has some limitations. While it provides a snapshot of customer sentiment at a specific moment, it may not accurately predict long-term customer behavior or loyalty. It’s also susceptible to response bias, where customers with extreme opinions (either very positive or very negative) are more likely to respond. Furthermore, CSAT surveys, in their simplicity, don’t always capture the nuances of the emotional connection customers have with a brand. They provide limited insight into the underlying reasons for satisfaction or dissatisfaction, often relying on additional qualitative feedback for deeper understanding. Finally, the timing of the survey can influence responses, as satisfaction levels may fluctuate shortly after an interaction compared to a later date.
To effectively use CSAT, consider these tips: send surveys immediately after interactions to maximize accurate recall, keep surveys short (1-3 questions maximum to avoid survey fatigue), and include an open-ended question to gather valuable qualitative insights. Setting target CSAT scores, typically 80% or higher for excellent service, and tracking trends over time rather than focusing on individual scores, provides a more comprehensive understanding of customer satisfaction performance.
The infographic below visualizes the difference in CSAT scores between the industry average and top performers.
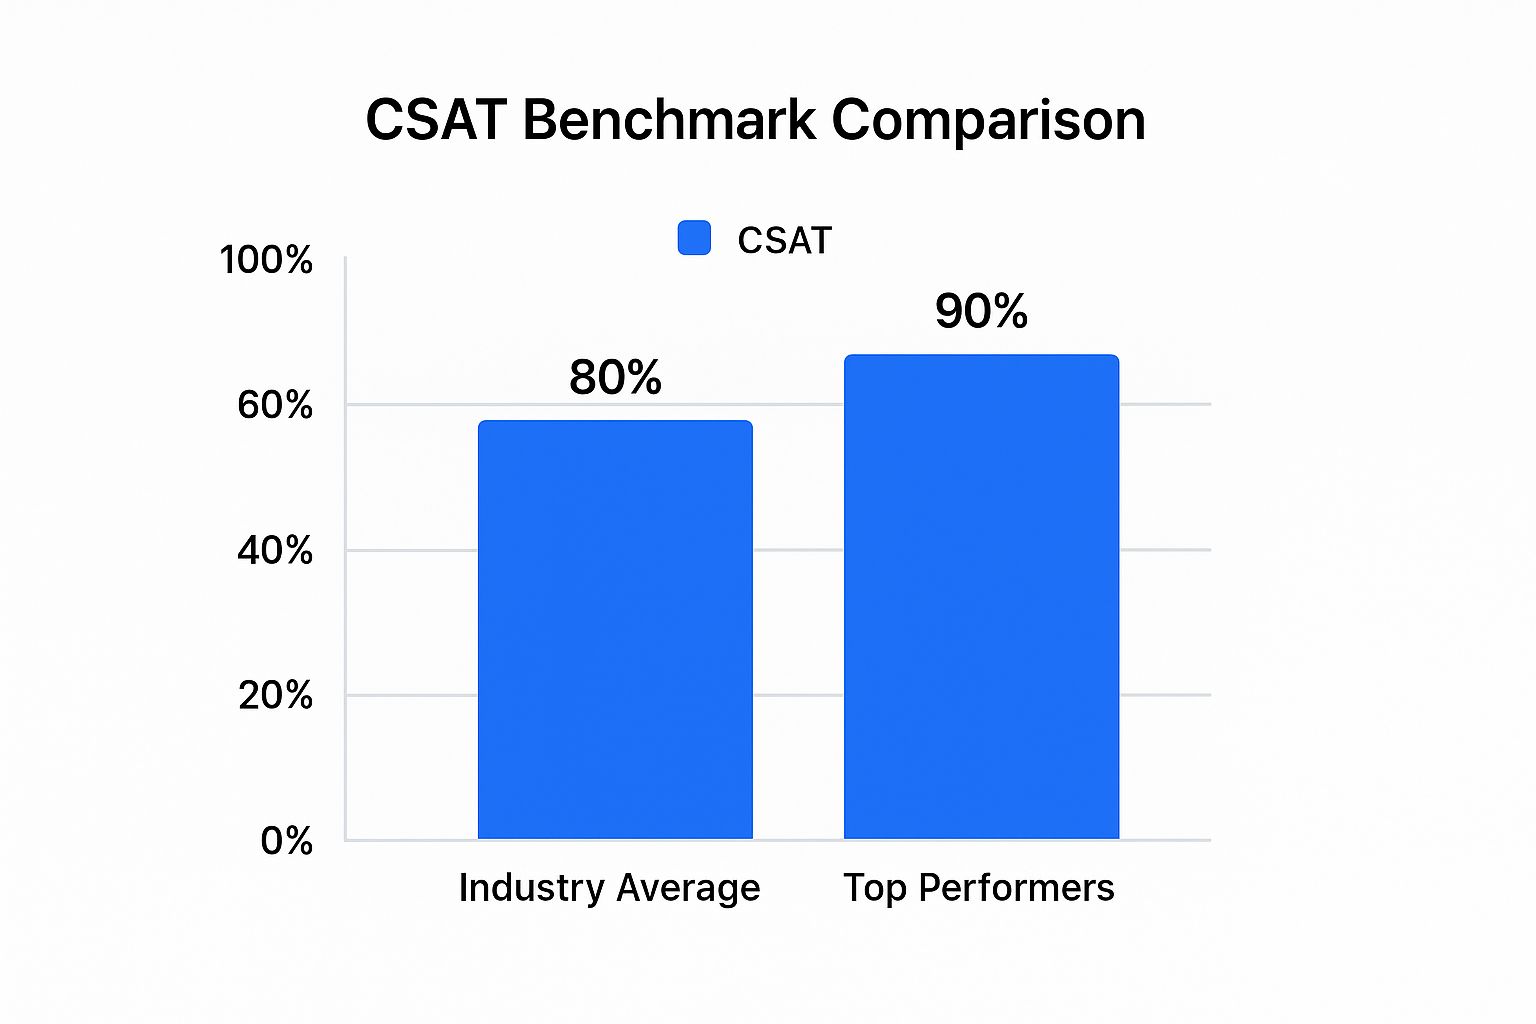
This simple bar chart clearly illustrates the benchmark for CSAT performance, showing that top performers achieve a CSAT score of 90%, a full 10 percentage points higher than the industry average of 80%. This highlights the potential for improvement and the importance of striving for excellence in customer satisfaction.
Learn more about Customer Satisfaction Score (CSAT)
By understanding the strengths and limitations of CSAT, and by implementing the suggested best practices, businesses can leverage this valuable metric to improve customer experiences, boost loyalty, and drive growth. Using CSAT as part of a broader suite of customer service performance indicators gives a well-rounded view of customer sentiment and provides actionable insights to enhance every aspect of the customer journey.
2. Net Promoter Score (NPS)
Net Promoter Score (NPS) is a widely recognized customer service performance indicator and loyalty metric that gauges customer willingness to recommend a company’s products or services to others. It provides a simple yet powerful way to understand customer sentiment and predict business growth. By focusing on the likelihood of recommendation, NPS delves into the core of customer loyalty, identifying not only satisfied customers but also true advocates who actively promote your brand. This makes it a valuable tool for businesses of all sizes, from small startups to large corporations. Its simplicity and broad applicability make it a cornerstone of many customer experience management programs.

The beauty of NPS lies in its straightforward approach. Customers are asked a single question: “How likely are you to recommend [company name] to a friend or colleague?” They respond using a 0-10 rating scale, where 0 represents “Not at all likely” and 10 signifies “Extremely likely.” Based on their responses, customers are segmented into three categories:
- Promoters (9-10): These are your loyal enthusiasts, actively championing your brand and driving new business through word-of-mouth referrals.
- Passives (7-8): These customers are generally satisfied but not necessarily loyal. They are vulnerable to competitive offerings and less likely to actively recommend your brand.
- Detractors (0-6): These are dissatisfied customers who may actively discourage others from engaging with your business. They represent a risk to your reputation and potential for churn.
The NPS itself is calculated by subtracting the percentage of Detractors from the percentage of Promoters. For instance, if 50% of respondents are Promoters and 20% are Detractors, your NPS would be 30. This score provides a clear benchmark for evaluating customer loyalty and tracking progress over time.
Several features contribute to the popularity and effectiveness of NPS. The single-question format makes it easy for customers to understand and complete, maximizing response rates. The 0-10 scale with clear customer segmentation provides actionable insights into customer sentiment. As an industry-standardized metric, NPS allows for benchmarking against competitors and identifying areas for improvement. Perhaps most importantly, NPS has been shown to be a strong predictor of business growth, demonstrating a clear link between customer loyalty and revenue.
Successful Implementations of NPS:
- Apple: Known for its exceptional customer experience, Apple consistently achieves high NPS scores, often exceeding 70. This reflects their dedication to building a loyal customer base.
- Tesla: Tesla’s innovative products and strong customer focus have resulted in remarkably high NPS scores, reaching 96 in some regions, showcasing the power of customer advocacy.
- Southwest Airlines: Southwest Airlines utilizes NPS to identify areas for service improvement and enhance the overall customer journey, demonstrating the practical application of NPS for operational optimization.
- HubSpot: HubSpot, a leading marketing software company, leverages NPS to track customer loyalty across different segments, providing granular insights into customer satisfaction and identifying opportunities for personalized engagement.
Tips for Effective NPS Implementation:
- Follow up: Don’t just collect the score. Follow up with open-ended questions to understand the reasoning behind customer ratings. This qualitative data provides valuable context and identifies specific areas for improvement.
- Regular Surveys: Survey customers regularly, either quarterly or bi-annually, to track trends and identify shifts in customer sentiment.
- Segmentation: Segment your NPS results by customer type, product, or service to gain deeper insights into specific customer groups and tailor your strategies accordingly.
- Close the Loop: Respond to detractors promptly and address their concerns. This proactive approach can help mitigate negative word-of-mouth and potentially convert detractors into passives or even promoters.
- Track Trends: Focus on tracking NPS trends over time rather than fixating on absolute scores. This provides a more accurate picture of your progress and the impact of your customer experience initiatives.
While NPS offers significant advantages, it’s crucial to be aware of its limitations. It doesn’t provide detailed explanations for customer sentiment. Cultural differences can influence scoring patterns, and the metric may not capture satisfaction with specific interactions. Furthermore, passive customers are excluded from the calculation, and scores can be influenced by recent experiences. Despite these limitations, NPS remains a valuable customer service performance indicator, providing a powerful snapshot of customer loyalty and its correlation with business growth. By understanding its strengths and weaknesses, and implementing it strategically, businesses can leverage NPS to drive customer-centric improvements and fuel sustainable growth. Popularized by Fred Reichheld and Bain & Company, NPS continues to be a cornerstone of customer experience management for organizations worldwide.
3. First Call Resolution (FCR)
First Call Resolution (FCR) is another effective customer service and a key performance indicator. It represents the percentage of customer inquiries or issues that are fully resolved during the initial interaction with a customer service representative, eliminating the need for follow-up calls, emails, or escalations. This metric isn’t just about efficiency; it directly impacts customer satisfaction and operational costs, making it a crucial element for businesses aiming to provide exceptional customer experiences. A high FCR rate translates to happier customers, reduced operational expenses, and a more efficient support team. This is why it deserves a prominent place in any list of essential customer service performance indicators.

FCR applies across all communication channels, including phone, email, chat, and social media. A customer reaching out via any of these methods should ideally have their issue resolved within that single interaction. Achieving this requires knowledgeable and empowered agents, efficient systems, and a focus on delivering comprehensive solutions from the outset.
The benefits of prioritizing FCR are substantial. For customers, it means a smoother, less frustrating experience. They don’t have to repeat their issue multiple times or spend extra time chasing a resolution. This reduction in customer effort directly correlates with higher customer satisfaction and loyalty. For businesses, a higher FCR translates to significant cost savings. Fewer follow-up interactions mean reduced agent workload, lower call volumes, and less time spent on managing ongoing cases. It also frees up resources that can be allocated to other areas of the business.
Pros of Focusing on FCR:
- Strong correlation with customer satisfaction: Resolved issues on the first attempt lead to happier customers.
- Significant reduction in operational costs: Fewer follow-ups mean lower agent workload and call volumes.
- Decreased customer effort and frustration: Customers avoid the hassle of repeated calls and explanations.
- Improved agent productivity and morale: Agents feel more accomplished and empowered.
- Reduced call volume and wait times: Frees up agents to handle new inquiries more quickly.
Cons of Focusing on FCR:
- Difficulty tracking across multiple channels: Requires integrated systems to consolidate data.
- Potential for rushed resolutions: Overemphasis on FCR can lead to incomplete or inaccurate solutions.
- Doesn’t account for complex issues: Some issues inherently require multiple touchpoints.
- Need for robust tracking systems: Accurate measurement requires investment in appropriate technology.
- Potential conflict with other metrics: Balancing FCR with metrics like handle time can be challenging.
Examples of Successful FCR Implementation:
- Ritz-Carlton: Empowers front-line staff to resolve issues up to $2,000, demonstrating a commitment to immediate customer satisfaction.
- Zappos: Prioritizes FCR through extensive agent training, equipping representatives to handle a wide range of inquiries effectively.
- American Express: Achieved over 85% FCR through process optimization, streamlining workflows and improving agent efficiency.
- Dell: Improved FCR by 15% through better knowledge management systems, enabling agents to quickly access relevant information.
Tips for Improving FCR:
- Invest in comprehensive agent training and knowledge bases: Equip agents with the skills and information they need to resolve issues effectively.
- Empower agents with the authority to resolve common issues: Give agents the autonomy to make decisions and provide solutions without excessive escalation.
- Implement robust case tracking across all channels: Ensure accurate data collection and analysis to monitor FCR performance.
- Regular coaching based on FCR performance: Provide feedback and guidance to help agents improve their FCR rates.
- Balance FCR with quality: Don’t sacrifice the quality of the resolution for the sake of speed. Address complex issues thoroughly, even if it requires multiple interactions.
By understanding the nuances of FCR, its benefits, and potential pitfalls, businesses can leverage this critical metric to improve customer satisfaction, streamline operations, and boost their bottom line. Focusing on FCR is an investment in both your customers and your business’s future. It represents a shift from reactive customer service to a proactive, solution-oriented approach, ultimately contributing to stronger customer relationships and sustainable growth.
4. Average Response Time
Average response time is a customer service performance indicator that measures the speed at which your team responds to customer inquiries. It tracks the time elapsed between a customer initiating contact and a representative providing the first response, acknowledging their message and indicating that their issue is being addressed. This initial acknowledgment, though it doesn’t signify a full resolution, plays a significant role in shaping customer perception and managing expectations. In today’s fast-paced world, where customers expect immediate attention, a swift response can significantly impact satisfaction levels and brand loyalty. This metric applies across all communication channels, including phone, email, chat, and social media, reflecting your overall responsiveness as a business.
Average response time deserves a prominent place in any list of customer service performance indicators because it directly correlates with customer satisfaction. A slow response can lead to frustration, negative reviews, and ultimately, lost customers. Conversely, a quick response demonstrates that you value your customers’ time and are committed to addressing their needs efficiently. This metric provides valuable insights into your team’s performance, enabling you to identify areas for improvement and optimize your customer service strategy.
One of the key features of average response time is its versatility. It can be measured across all communication channels, providing a holistic view of your responsiveness. It’s important to note that it tracks the initial response, not the full resolution time. This allows for a more granular analysis of the customer journey and helps identify bottlenecks in the initial contact phase. Furthermore, average response time can be segmented by priority, channel, or issue type, providing more specific insights into performance. Real-time monitoring capabilities are also essential, enabling managers to track response times as they happen and intervene when necessary. This metric also allows for setting channel-specific expectations, understanding that response times for phone calls should differ from those for email or social media inquiries.
Several benefits arise from tracking and optimizing average response time. It’s relatively easy to measure and track automatically with the help of customer service software. Improving this metric directly impacts customer satisfaction and loyalty, leading to positive word-of-mouth referrals and repeat business. By analyzing response times, you can optimize staffing and resource allocation to ensure adequate coverage during peak hours. Tracking average response time also enables compliance with service level agreements (SLAs), which are often crucial for B2B businesses. Finally, it allows for channel-specific optimization, ensuring that each communication channel is handled effectively.
However, average response time is not without its limitations. It doesn’t measure the quality of the response, which is equally important for customer satisfaction. Focusing solely on speed may encourage rushed, inadequate responses that fail to address the customer’s issue effectively. As mentioned earlier, it varies greatly by communication channel, making direct comparisons difficult. It also doesn’t account for issue complexity – a simple password reset will naturally have a shorter response time than a complex technical problem. Finally, this metric can be manipulated through automated responses, which might acknowledge the inquiry without providing actual assistance.
Several companies excel at managing their average response time. For instance, Twitter’s customer service aims to respond within 30 minutes during business hours, while Amazon targets a 24-hour response time for emails. Salesforce maintains even more stringent sub-2-hour response times for their priority customers. Buffer, a social media management platform, prioritizes quick responses to social media inquiries, aiming for a 1-hour turnaround time. These examples demonstrate how businesses can leverage efficient processes and dedicated teams to achieve impressive response times.
To improve your average response time, consider these actionable tips: Set different response time goals for different channels, acknowledging the varying expectations across platforms. Utilize auto-acknowledgments for emails, informing customers that their message has been received while you work on a detailed response. Implement escalation procedures for urgent issues to ensure they receive immediate attention. Monitor response times in real-time with alerts, enabling proactive intervention. Finally, and most importantly, strive to balance speed with quality – acknowledge quickly, but resolve thoroughly. Learn more about Average Response Time as you investigate options to improve your customer service performance. By focusing on both speed and quality, you can deliver exceptional customer experiences and build stronger customer relationships.
5. Customer Effort Score (CES)
Customer Effort Score (CES) is a crucial customer service performance indicator that measures how much effort a customer has to exert to get their issue resolved, request fulfilled, or complete a desired action. Unlike traditional customer satisfaction metrics that focus on exceeding expectations and “delighting” customers, CES operates on the principle that reducing customer effort is a more effective driver of loyalty. In the fast-paced world of today’s customer, minimizing friction and simplifying interactions is paramount. This is why CES deserves its place among the top customer service performance indicators.
The core of CES lies in asking customers a simple question immediately after a service interaction, typically using a scale from 1 to 7, ranging from “very difficult” to “very easy.” For example, “How easy was it to get your issue resolved today?” By focusing on the ease of the experience, businesses gain valuable insights into pain points and areas for improvement within their customer journey. This focus on effort reduction aligns with the reality that customers primarily want quick, efficient, and painless solutions. They don’t necessarily need to be “wowed” every time; they just want things to work smoothly.
Several key features distinguish CES from other customer service metrics. It specifically measures the ease of issue resolution and typically uses a 1-7 scale. This allows for a nuanced understanding of the customer’s experience and provides a clear benchmark for improvement. Moreover, CES focuses squarely on effort reduction rather than satisfaction. While satisfaction is important, research suggests that reducing customer effort has a stronger correlation with loyalty and repurchase behavior. This metric can be applied to specific processes, like returns or technical support, or to the overall customer experience. By analyzing CES data, businesses can identify specific friction points within their processes and prioritize improvements.
The benefits of using CES are numerous. It’s a strong predictor of customer loyalty and retention. By identifying friction points in the customer journey, businesses can proactively address issues and improve the overall customer experience. CES provides actionable insights for process improvement, allowing businesses to streamline operations and reduce wasted effort for both customers and agents. It’s also generally less emotionally driven than satisfaction scores, which can fluctuate based on individual customer temperaments. This makes CES a more reliable indicator of operational efficiency. Finally, CES helps prioritize operational improvements, allowing businesses to allocate resources effectively.
However, like any metric, CES has its limitations. It’s a relatively new metric compared to traditional satisfaction measures, meaning there’s less historical data available for benchmarking. It may not fully capture the emotional aspects of the customer service experience, which can still play a role in overall satisfaction. The interpretation of “easy” can be subjective, based on individual customer expectations and past experiences. Therefore, careful question design is crucial to ensure accurate and actionable data. Furthermore, CES, on its own, may not reflect the overall health of the customer relationship, which can be influenced by numerous other factors.
Several companies have demonstrated the power of CES in driving impactful changes. Google, for instance, simplified its support process based on CES feedback, resulting in a smoother experience for its users. Maersk, a global shipping company, reduced customer effort by streamlining its booking processes, leading to increased efficiency and customer satisfaction. Lexus leverages CES to optimize their service appointment scheduling, ensuring a convenient and hassle-free experience for their customers. Even software giant Intuit utilized effort score insights to improve its popular TurboTax software.
To effectively leverage CES in your own business, consider the following tips: Ask effort questions immediately after service interactions while the experience is still fresh in the customer’s mind. Focus on specific processes, such as checkout or technical support, rather than the general experience to pinpoint areas for improvement. Use the insights gained from CES data to eliminate unnecessary steps in the customer journey, streamlining processes and reducing friction. Combine CES with other customer service metrics, like CSAT and NPS, for a more complete picture of customer experience. Finally, train customer service agents to proactively reduce customer effort by anticipating customer needs and providing efficient solutions.
Learn more about Customer Effort Score (CES) and how integrating tools like chatbots can contribute to reducing customer effort and improving overall satisfaction.
By understanding and implementing CES as a key customer service performance indicator, businesses can gain a competitive edge by creating smoother, more efficient, and ultimately more rewarding experiences for their customers, leading to increased loyalty and long-term success. Popularized by the research of Matthew Dixon and publications in the Harvard Business Review and by the Corporate Executive Board, CES has become a vital tool for organizations focused on optimizing customer service and building lasting customer relationships.
6. Average Handle Time (AHT)
Average Handle Time (AHT) is a crucial customer service performance indicator that measures the average duration of a complete customer interaction. This includes the time spent talking to the customer, any hold time, and the after-call work required to wrap up the interaction. AHT is a powerful operational efficiency metric that helps organizations optimize staffing levels, accurately forecast capacity needs, and strike a delicate balance between efficiency and delivering high-quality service. Its significance is particularly pronounced in call centers and contact centers, where effective resource planning is paramount. For businesses striving to understand and improve their customer service operations, AHT provides valuable insights into agent performance, process efficiency, and overall operational costs. This makes it a critical component of any comprehensive suite of customer service performance indicators.
AHT encompasses the total interaction time, capturing everything from the initial hello to the final documentation. It’s calculated by adding the talk time, hold time, and wrap-up time, then dividing by the total number of interactions handled. This metric isn’t limited to phone calls; it can be measured across different channels, including email, chat, and social media, and across different interaction types, such as technical support, billing inquiries, or general customer service. This multi-channel applicability allows businesses to gain a holistic view of their customer service efficiency across all touchpoints.
Why is AHT important?
AHT plays a vital role in capacity planning and forecasting. By understanding the average time it takes to handle different types of customer interactions, businesses can accurately predict the number of agents required to meet anticipated call volumes and service level agreements. This data-driven approach to staffing ensures that businesses have the right resources in place to handle customer inquiries promptly and efficiently, minimizing wait times and maximizing customer satisfaction. Moreover, AHT is critical for operational cost management. By analyzing AHT trends and identifying areas for improvement, businesses can reduce labor costs, improve agent productivity, and optimize resource allocation.
AHT also varies significantly based on the complexity of the issue and the experience level of the agent. Complex technical issues naturally take longer to resolve than simple billing inquiries. Similarly, experienced agents often handle interactions more efficiently than newer agents. Recognizing these variations allows businesses to segment their AHT data for more meaningful analysis and targeted improvements.
Benefits of Monitoring AHT:
- Workforce planning and scheduling: Accurate AHT data enables effective scheduling and minimizes overstaffing or understaffing, leading to cost savings and improved service levels.
- Training needs identification: Consistently high AHT for certain agents or call types can highlight training needs and skill gaps, enabling targeted training interventions.
- Process inefficiency detection: Analyzing AHT can reveal inefficiencies in internal processes or systems, prompting process improvements and automation.
- Accurate cost-per-contact calculations: AHT is a key input for calculating the cost of each customer interaction, enabling businesses to track and manage their customer service expenses.
- Agent performance comparison: AHT can be used to compare agent performance and identify top performers and areas for individual improvement.
- Service level planning: AHT data informs service level planning by allowing businesses to predict how quickly they can handle customer inquiries and meet service level targets.
Potential Drawbacks of Focusing Solely on AHT:
- Rushed service: Overemphasis on reducing AHT can pressure agents to rush through interactions, potentially compromising service quality and customer satisfaction.
- Ignoring complexity: AHT doesn’t inherently account for the varying complexity of customer issues, potentially penalizing agents handling more complex cases.
- Reduced thoroughness: Pressure to meet AHT targets can discourage agents from thoroughly addressing customer issues, leading to unresolved problems and repeat calls.
- Conflict with First Call Resolution (FCR): Focusing solely on AHT can conflict with FCR goals if agents prioritize speed over resolution.
- Lack of direct customer satisfaction measurement: AHT doesn’t directly measure customer satisfaction, so it should be used in conjunction with other customer feedback metrics.
Examples of Successful AHT Implementation:
- Companies like American Express have optimized AHT while maintaining high service quality by implementing better call scripting and agent training programs.
- Geico has achieved significant AHT reductions through process automation and streamlined workflows.
- T-Mobile has successfully balanced AHT reduction with customer satisfaction improvements by focusing on agent empowerment and proactive problem-solving.
- Wells Fargo utilizes AHT segmentation by call type to gain deeper insights into performance and optimize resource allocation.
Tips for Effectively Utilizing AHT:
- Balance AHT with quality: Don’t prioritize AHT at the expense of customer satisfaction. Balance AHT goals with other key metrics like customer satisfaction (CSAT) and First Call Resolution (FCR).
- Segment AHT by call type and complexity: Analyze AHT separately for different call types and complexity levels to gain more meaningful insights and identify specific areas for improvement.
- Use AHT for coaching, not just evaluation: Use AHT data to coach agents on improving their efficiency, rather than solely using it for performance evaluations.
- Invest in agent training: Provide comprehensive training to equip agents with the skills and knowledge they need to handle interactions efficiently and effectively.
- Implement tools and scripts to reduce repetitive tasks: Automate repetitive tasks and provide agents with helpful scripts to streamline workflows and reduce handle times.
By carefully monitoring and analyzing AHT, and by implementing the tips outlined above, businesses can significantly improve their customer service operations, enhance agent performance, and optimize overall operational efficiency. Remember to always balance AHT goals with other crucial customer service performance indicators to ensure a holistic approach to service excellence.
7. Customer Retention Rate
Customer Retention Rate (CRR) is a critical customer service performance indicator that measures the percentage of customers who continue doing business with a company over a specified period. It provides valuable insights into the effectiveness of customer service efforts in fostering loyalty and building long-term relationships, directly impacting a company’s profitability. As a key performance indicator (KPI), CRR deserves its place on this list because it provides a high-level view of a business’s ability to satisfy and retain its customer base, which is significantly more cost-effective than constantly acquiring new customers. Studies consistently show that acquiring a new customer can be 5 to 25 times more expensive than retaining an existing one. This makes understanding and optimizing CRR a crucial element of any successful business strategy, particularly for small businesses and entrepreneurs with limited resources.
CRR works by tracking the number of customers who remain active over a defined period. This period can be monthly, quarterly, or annually, depending on the business model and industry. The calculation is straightforward:
CRR = [(Number of Customers at End of Period – Number of New Customers Acquired During Period) / Number of Customers at Start of Period] x 100
For example, if a company started the quarter with 1000 customers, acquired 100 new customers, and ended the quarter with 1050 customers, the CRR would be [(1050 – 100) / 1000] x 100 = 95%. This indicates that the company retained 95% of its existing customer base during that quarter.
The power of CRR lies in its ability to reveal long-term customer relationship health. Unlike metrics that focus on immediate customer satisfaction, CRR provides a more holistic view of how well a business caters to its customers over time. This is invaluable for businesses seeking sustainable growth, as a loyal customer base provides a stable revenue stream and positive word-of-mouth referrals.
Several successful businesses demonstrate the impact of prioritizing customer retention. Amazon Prime boasts incredibly high annual retention rates exceeding 90%, largely attributed to its value-added services and exceptional customer support. Netflix maintains high retention through personalized recommendations and seamless streaming experiences. Starbucks leverages its rewards program to drive customer loyalty and achieve retention rates above 80%. Similarly, Salesforce invests heavily in customer success programs to foster strong relationships and secure high retention rates. These examples underscore the importance of a customer-centric approach in achieving sustainable business growth.
Features and Benefits of Tracking CRR:
- Measures long-term customer relationship health: CRR provides a comprehensive overview of customer loyalty and satisfaction over extended periods.
- Directly correlates with revenue and profitability: Higher retention rates translate to increased revenue and reduced customer acquisition costs.
- Segmentable: CRR can be analyzed by customer type, product, or service tier to identify areas for improvement.
- Inverse relationship with customer churn rate: Tracking CRR helps identify potential churn risks and implement proactive retention strategies.
Pros:
- Strong indicator of overall business health: CRR reflects customer satisfaction and the effectiveness of retention strategies.
- Directly tied to revenue and profitability: Retaining customers is more cost-effective than acquiring new ones.
- Measures the long-term impact of service quality: CRR reveals the lasting effects of good customer service.
Cons:
- Lagging indicator: CRR shows past performance and may not immediately reflect recent service improvements.
- External influences: Factors outside customer service can affect CRR.
- Lack of detailed insights: CRR doesn’t explain the specific reasons why customers stay or leave.
Actionable Tips for Improving CRR:
- Segment and Analyze: Track CRR by different customer segments and service tiers to identify areas for improvement.
- Proactive Outreach: Implement proactive outreach programs to at-risk customers to address their concerns and improve satisfaction.
- Predictive Analytics: Utilize predictive analytics to identify potential churn risks and implement preventative measures.
- Onboarding and Early Experience: Focus on providing a positive onboarding experience and building strong relationships early on.
- Regular Check-ins: Maintain regular communication with high-value customers to ensure their continued satisfaction.
By understanding and actively managing your Customer Retention Rate, you can build a loyal customer base, enhance profitability, and ensure the long-term success of your business. This metric provides a powerful lens through which to view the effectiveness of your customer service strategy and make informed decisions that drive sustainable growth.
8. Service Level Agreement (SLA) Compliance
Service Level Agreement (SLA) compliance stands as a critical customer service performance indicator, especially for businesses aiming to provide consistent and predictable service. It represents the percentage of customer service interactions that successfully meet the predefined standards and timeframes outlined within your Service Level Agreements. In essence, SLA compliance measures how effectively your organization delivers on its promises to customers concerning response times, resolution times, and overall service quality standards. This metric is particularly relevant for customer support teams, sales and marketing professionals, e-commerce managers, and digital agencies working to optimize customer experience and build trust. For small businesses and entrepreneurs, establishing and adhering to SLAs, even basic ones, can significantly enhance professionalism and customer satisfaction.
SLA compliance encompasses multiple metrics working in concert. Response time, arguably the most visible element, tracks how quickly a customer receives an initial response after initiating contact. Resolution time focuses on the total time taken to completely address and resolve the customer’s issue. Quality standards, often less quantifiable but equally important, cover aspects like the accuracy of information provided, the professionalism of communication, and the overall helpfulness of the interaction. These combined metrics offer a comprehensive view of service delivery performance.
Several features distinguish SLA compliance as a powerful performance indicator. It inherently measures adherence to promised service standards, providing a concrete benchmark for evaluating service delivery. The inclusion of multiple metrics offers a nuanced perspective beyond simple response times, encompassing the entire customer journey. Furthermore, SLA compliance can be segmented by customer tier or service type, allowing businesses to tailor service levels and track performance for different customer segments. In B2B environments, SLAs often become legally binding agreements, adding a layer of accountability and protection for both parties. Crucially, SLAs directly tie into customer expectations management, shaping what customers anticipate from their interactions with your business.
The benefits of prioritizing SLA compliance are substantial. Clear and measurable service commitments build trust and set clear expectations for customers. In B2B relationships, SLAs offer legal protection and define the parameters of service delivery. Internally, focusing on SLA compliance drives consistent service delivery across the organization. Moreover, it enables performance-based contracts and pricing, aligning incentives and rewarding high-quality service.
However, implementing and managing SLAs also presents challenges. Overly strict or complex SLAs can become bureaucratic and inflexible, potentially hindering service agents’ ability to adapt to unique customer situations. An excessive focus on meeting minimum requirements may inadvertently encourage a culture of minimal compliance rather than striving for service excellence. Tracking and reporting SLA performance requires significant overhead in terms of systems and manpower. Standard SLAs might also struggle to account for the varying complexity of customer issues, penalizing agents for factors outside their control. Finally, if SLAs are not met and handled transparently, they can create adversarial customer relationships, leading to frustration and distrust.
Numerous successful implementations of SLAs highlight their effectiveness. Microsoft Azure, for instance, guarantees 99.9% uptime for its cloud services and provides transparent SLA compliance tracking. Salesforce offers detailed SLA compliance reporting to its enterprise customers, empowering them to monitor service performance closely. IBM offers tiered SLA compliance based on customer service levels, recognizing the diverse needs of different customer segments. Amazon Web Services maintains strict SLA compliance, offering automatic credits for violations, demonstrating a commitment to accountability and customer satisfaction.
To effectively leverage SLA compliance, consider these practical tips. First, set realistic and achievable SLA targets based on your current capabilities and resources. Implement real-time monitoring and alerting systems to identify and address potential SLA breaches proactively. Regularly review and update SLAs based on evolving business needs and technological advancements. Communicate SLA performance transparently to customers, building trust and demonstrating accountability. Finally, utilize SLA data to identify process improvement opportunities and optimize service delivery workflows.
By understanding the nuances of SLA compliance and strategically implementing these best practices, businesses can leverage this powerful performance indicator to enhance customer satisfaction, build stronger relationships, and drive operational efficiency.
8 Key Customer Service Metrics Comparison
| Performance Indicator | 🔄 Implementation Complexity | ⚡ Resource Requirements | 📊 Expected Outcomes | 💡 Ideal Use Cases | ⭐ Key Advantages |
|---|---|---|---|---|---|
| Customer Satisfaction Score (CSAT) | Low – Simple survey deployment | Low – Minimal tools needed | Immediate feedback on specific interactions | Post-interaction feedback | Easy, cost-effective, quick insights |
| Net Promoter Score (NPS) | Low – Single question survey | Low – Basic survey software | Measures loyalty and predicts growth | Measuring customer advocacy & loyalty | Industry-standard, easy benchmarking |
| First Call Resolution (FCR) | Medium – Requires multi-channel tracking | Medium – Robust tracking and agent training | Improved satisfaction and operational cost reduction | Contact centers focusing on efficiency | Direct link to satisfaction and costs |
| Average Response Time | Medium – Cross-channel tracking needed | Medium – Automated tracking systems | Faster acknowledgment of customer inquiries | Managing customer expectations in multi-channel communication | Influences satisfaction and staffing |
| Customer Effort Score (CES) | Low to Medium – Survey with careful design | Low – Survey and analysis tools | Reduces customer effort, predicts loyalty | Process improvement and friction reduction | Strong predictor of loyalty, actionable |
| Average Handle Time (AHT) | Medium – Accurate interaction timing | Medium – Call center monitoring tools | Optimized staffing and cost control | Call/contact centers for operational efficiency | Essential for workforce planning |
| Customer Retention Rate | Medium – Requires customer tracking over time | Medium to High – CRM and analytics | Measures long-term loyalty and profitability | Evaluating overall business health | Directly tied to profitability and growth |
| SLA Compliance | High – Complex monitoring & reporting | High – Real-time tracking & alert systems | Ensures delivery on promised service levels | B2B service contracts and managed services | Builds trust, legal protection, consistency |
Transform Your Customer Service with Social Intents
From Customer Satisfaction Score (CSAT) and Net Promoter Score (NPS) to First Call Resolution (FCR) and Average Handle Time (AHT), understanding and actively monitoring customer service performance indicators is crucial for any business striving for excellence. We’ve explored eight key indicators in this article, each offering valuable insight into different facets of the customer journey. The most important takeaway is that these metrics, when used together, provide a holistic view of customer experience, allowing you to pinpoint areas of strength and identify opportunities for improvement. Mastering these concepts empowers you to make data-driven decisions, optimize resources, and ultimately drive customer loyalty and business growth.
Measuring and tracking these indicators is crucial for understanding customer sentiment and identifying areas for improvement. There are a variety of customer satisfaction measurement tools available to help you collect and analyze customer feedback. This resource from Testimonial Donut offers a comprehensive overview of options to help you get started. By consistently analyzing your performance against these benchmarks, you can proactively address customer pain points and cultivate a culture of continuous improvement within your customer service team.
By optimizing your customer service operations around these key performance indicators, you’re not just improving metrics; you’re building stronger customer relationships, fostering brand loyalty, and setting the stage for sustainable business success. Empower your team to deliver exceptional customer experiences and watch your business thrive.
Ready to streamline your customer service and boost your key performance indicators like AHT, FCR, and CSAT? Visit Social Intents today and discover how our AI-powered live chat solutions can revolutionize your customer interactions and help you achieve your customer service goals.